What's Covered
Where can I find course reports?
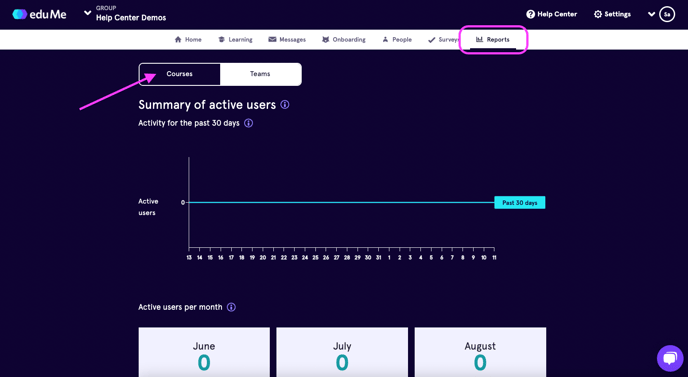
Course reports are found in the Reports tab of the eduMe admin panel. The ‘Courses’ toggle will be selected by default (you can switch between Course or Team reports here).
Scroll down to view the Course overview where you'll see a list of your published courses. Here, you can preview the number of learners who have completed each course in the past day, seven days and 30 days. Click ‘View course report’ to open a more detailed dashboard for a particular course or to download a CSV report.
Course report dashboard
Summary of active users
- The line graph shows total unique active users in the course over the last day, seven days, or 30 days
Note! Active users are those who have accessed at least one lesson in the course
- Move your mouse over the line graph to view the rolling number of users active in the course over a certain period
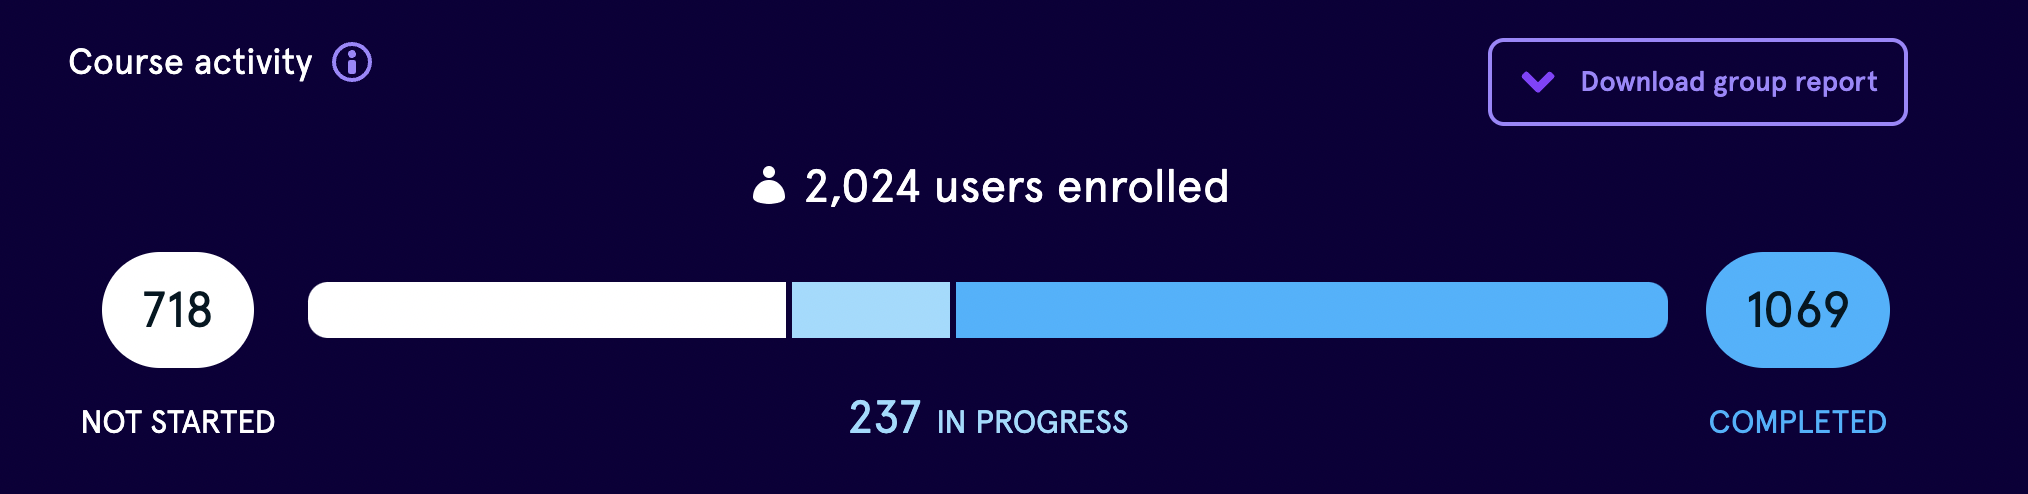
Course activity
- The bar graph shows the total number of users who have Not Started, are In Progress (completed at least one lesson) or have Completed the course. Hover over the bar graph to see the break down by percentage
- Download a report of course activity by clicking the Download group report button. See more about downloadable CSV reports below
Note: If the course is marked as priority, the group report that you can download lists users who've been assigned to the course, but haven't completed it yet.
Activity overview
The activity overview provides a breakdown of completion data for each activity (lesson, assessment or survey). Each activity is represented by its own card
Lessons
- LESSON COMPLETION shows the number of learners who have completed the lesson. LESSON SCORE is displayed for lessons with quizzes; the percentage indicates the average score amongst all learners who have completed the lesson
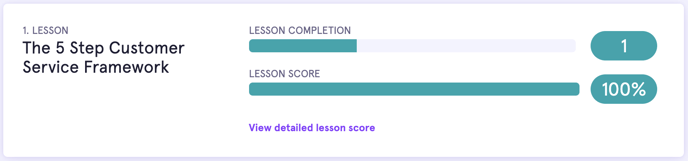
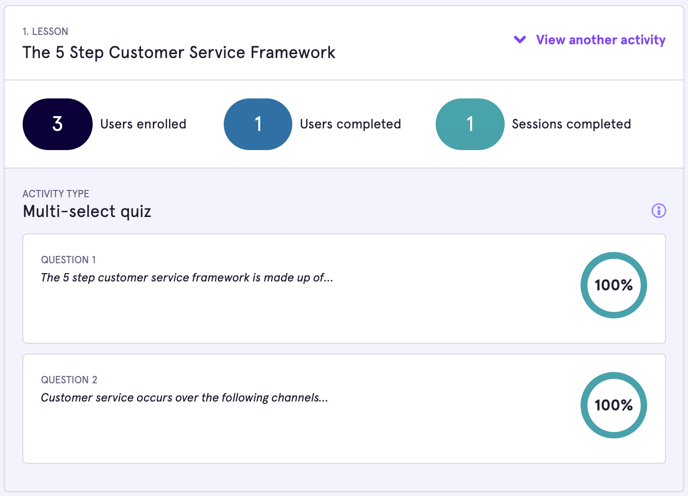
- Click ‘View detailed lesson score’ to analyse how learners are performing in quizzes. The percentage indicates the average score amongst all learners, per quiz question. These may be high, average, or low. It may show that questions are too easy, too difficult or that learners haven’t understood the lesson material
Tip! Lesson and quiz scores take averages across learners’ first attempts on a quiz. Additional attempts are not included in these figures
Assessments
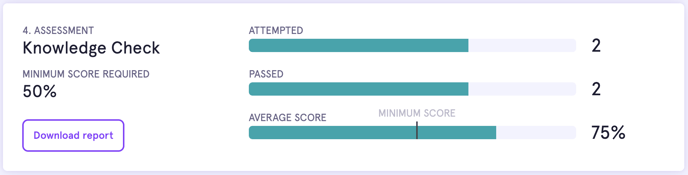
- For Assessments with a minimum score, you will see the number of of learners who have ATTEMPTED the Assessment (those who have passed or failed), the number of users who have COMPLETED the assessment (only those who have passed), and the AVERAGE SCORE across all attempts by all learners who have completed the assessment
- For Assessments with no minimum score, you will see the number of learners who have PASSED the assessments and the AVERAGE SCORE across all attempts by all learners who have completed the assessment
- Click ‘Download report’ to see individual learner scores, per attempt, in a CSV format. Correct answers will show as 100% and incorrect answers will show as 0%
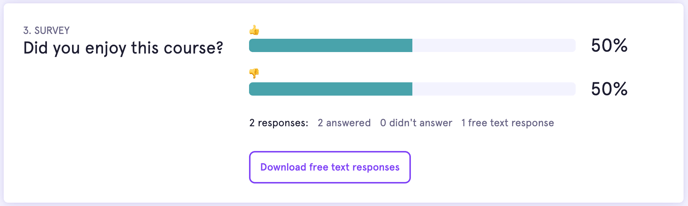
Surveys
- For Like/dislike surveys, you will see the percentage of learners who gave a thumbs up 👍 or thumbs down 👎 in response to the survey question
- For Multiple choice surveys, you will see the percentage of learners who chose each response
- The total number of interactions with your survey are provided at the bottom of the card. If you selected to include free text responses, you’ll see how many learners provided these; click ‘Download free text responses’ to view detailed answers
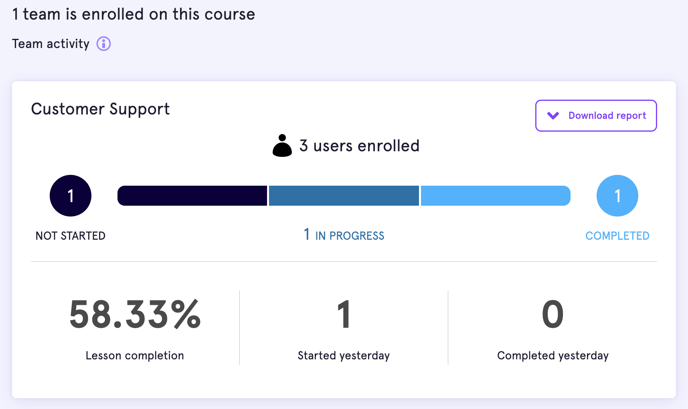
Team activity
- The bar graph shows learner completion stats for individual teams
- You’ll see here the total number of users enrolled in the course (for that team), and how many users have Not started, are In progress or have Completed the course
- The activity completion figure (as per screenshot) shows the percentage of activities that have been completed, out of the total number of activities available in this course, for this team
- You can also see a quick snapshot of how many users Started or Completed the course on the previous day
- Admins can download a report of course activity for each team by clicking the Download report button. Choose the All time option to include users who have Not Started
Course CSV report
For each course, you can download a CSV report of all learner activity. Here, you’ll be able to view:
- Unique learner details (first name, last name, email, phone, user info, identifiers, user activation date)
- Learner’s assigned teams
- Course completion status, including start and completion date/time
- Individual activity scores (for lessons and assessments taken more than once, the best score is shown here)
- Overall course score
Downloading course reports
To download a CSV course report:
- Click ‘Download group report’ from the Course activity panel
- For predetermined date ranges, select from:
- Last 7 days
- Last 30 days
- Last 60 days
- All time (this includes learners who have been assigned a course and have Not started)
- To choose your own date range, either:
- Type your date range in dd/mm/yyyy format OR
- Click the start and end date for the range you’d like to view data for
Individual User Reports
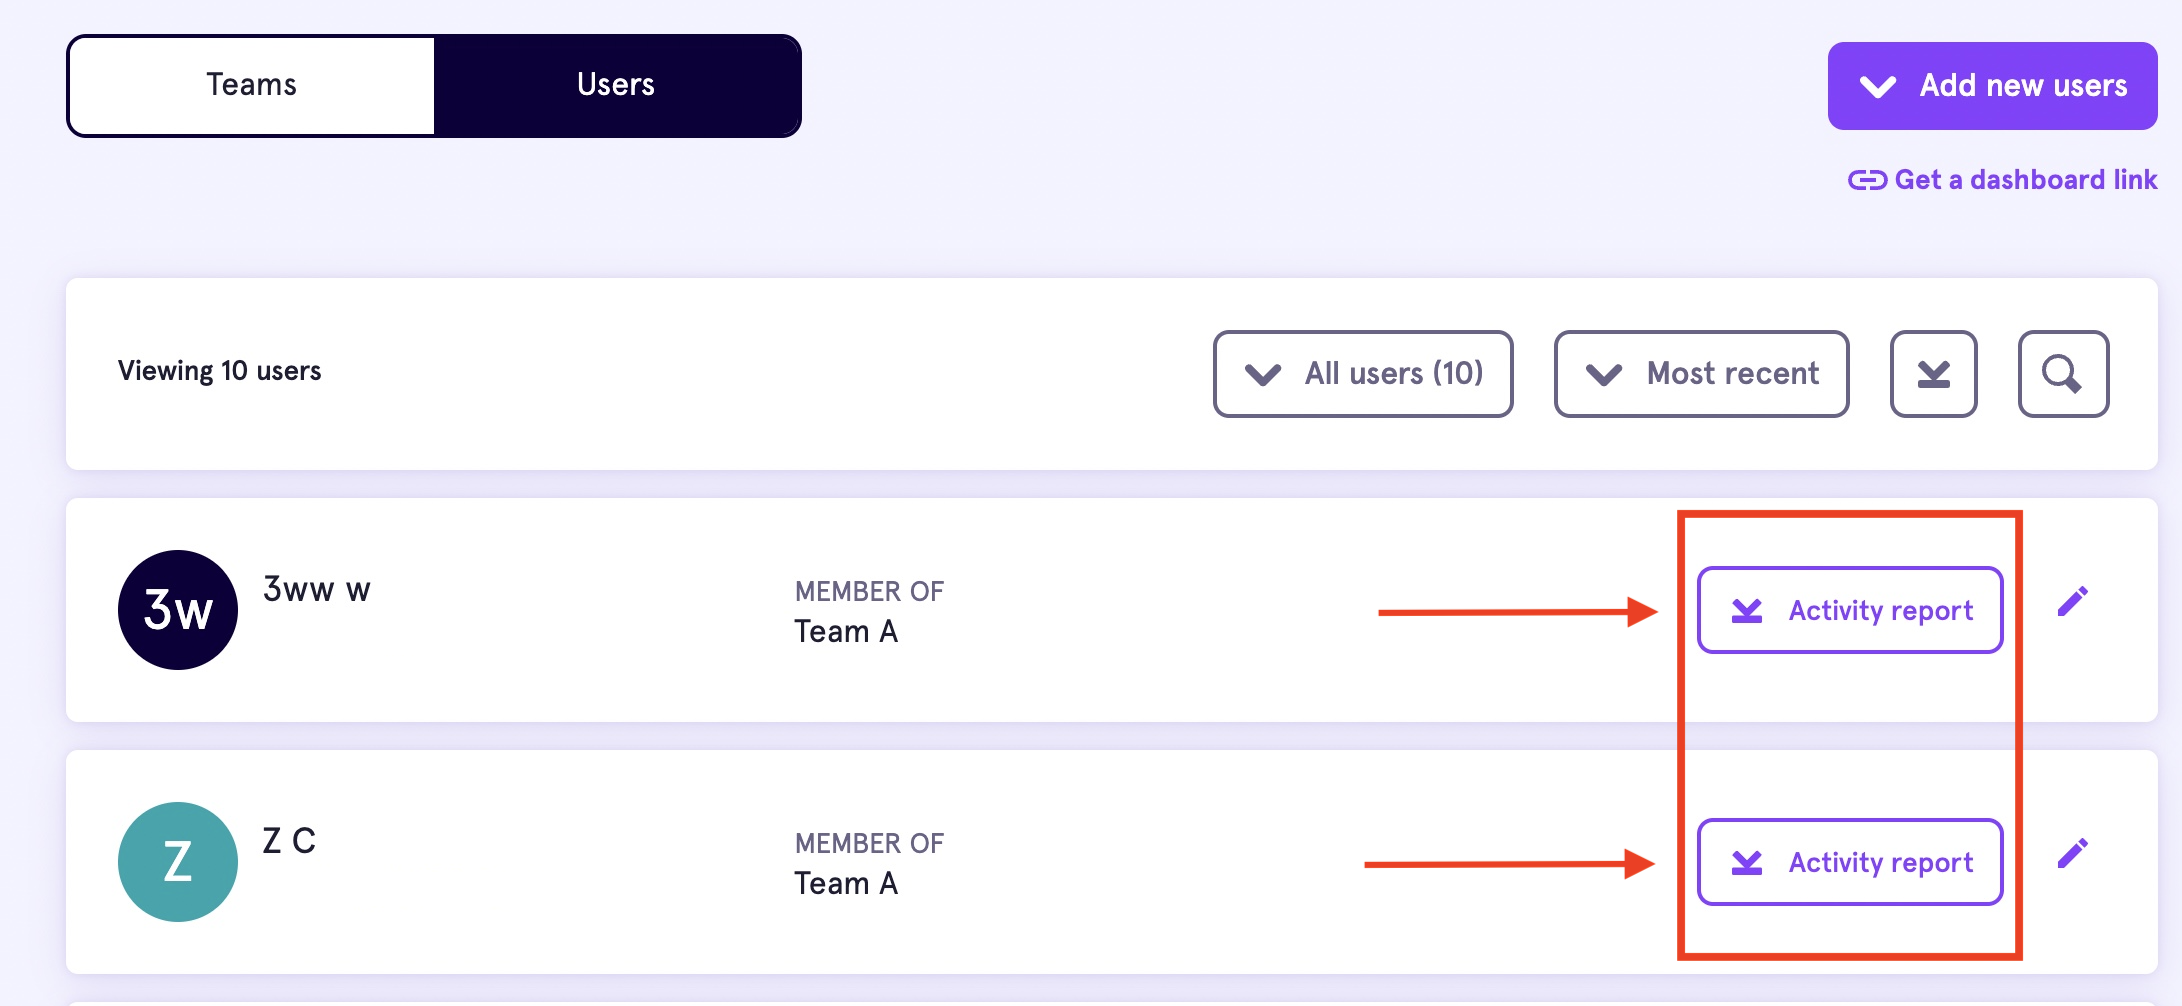
Admins can get full information regarding a user's activity and progress across the platform. You can access this in the Users section in the People tab.
- Each activated users course stats and activity can be downloaded in .csv format
- The csv will contain
- One header row
- One row per course
💡Speak to your Customer Success Manager for more detail regarding the individual user reports feature
FAQs
Q: Can I see course reports for unpublished courses?
A: No, you can only view reports for published courses in the Reports tab