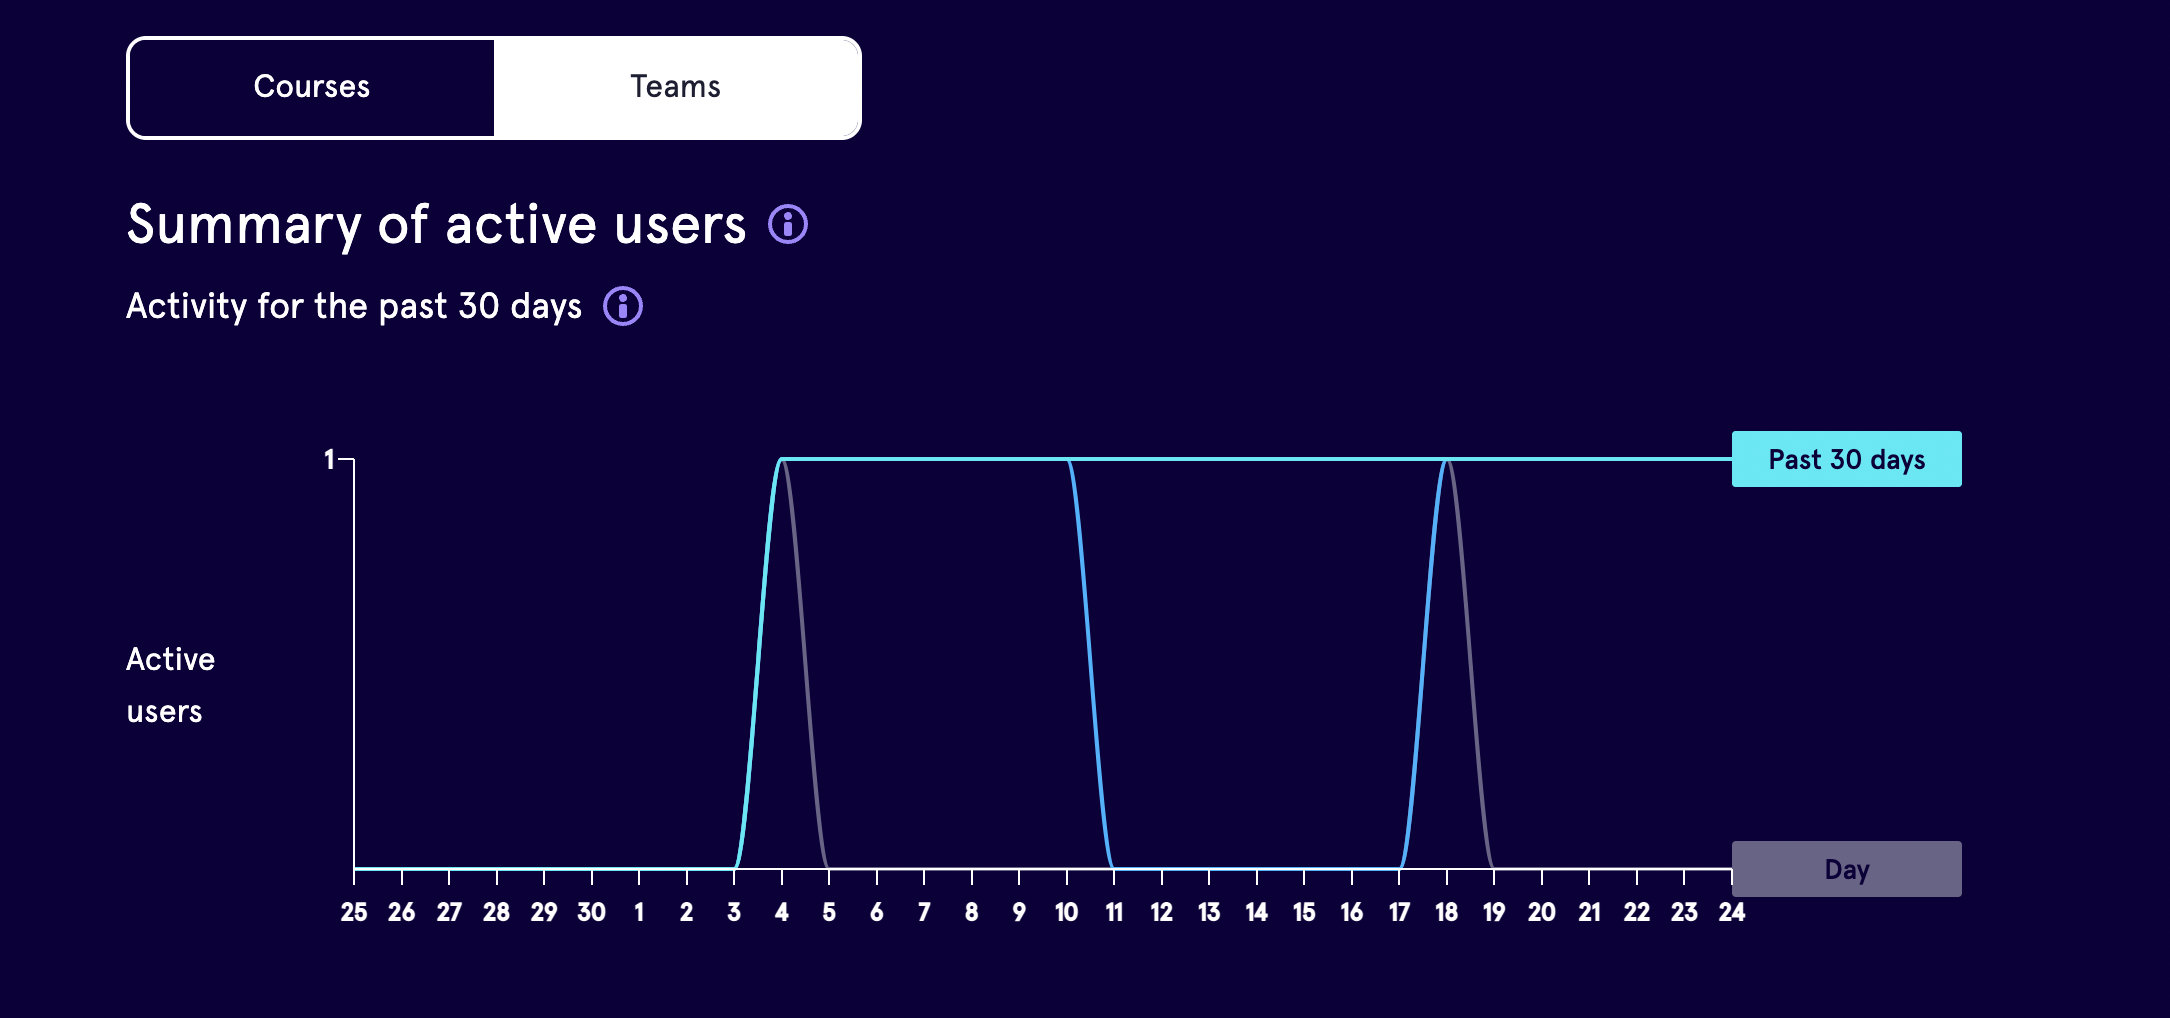
Summary of active users
-
This can be viewed within the Courses toggle of Reports within the Admin Panel
-
To see a more detailed break down of active users by specific date hover over the graphs
-
The line graph on the Reports overview page shows the overall usage trends and includes the total number of unique active users who have accessed the platform over the last day, 7 days, or 30 days
-
You can see the exact number of users active in the relevant period by moving your mouse over the graph
-
For example the graph below shows that 4 users were active that day (21st Feb), 19 users were active that week, and 21 users were active over the previous 30 days
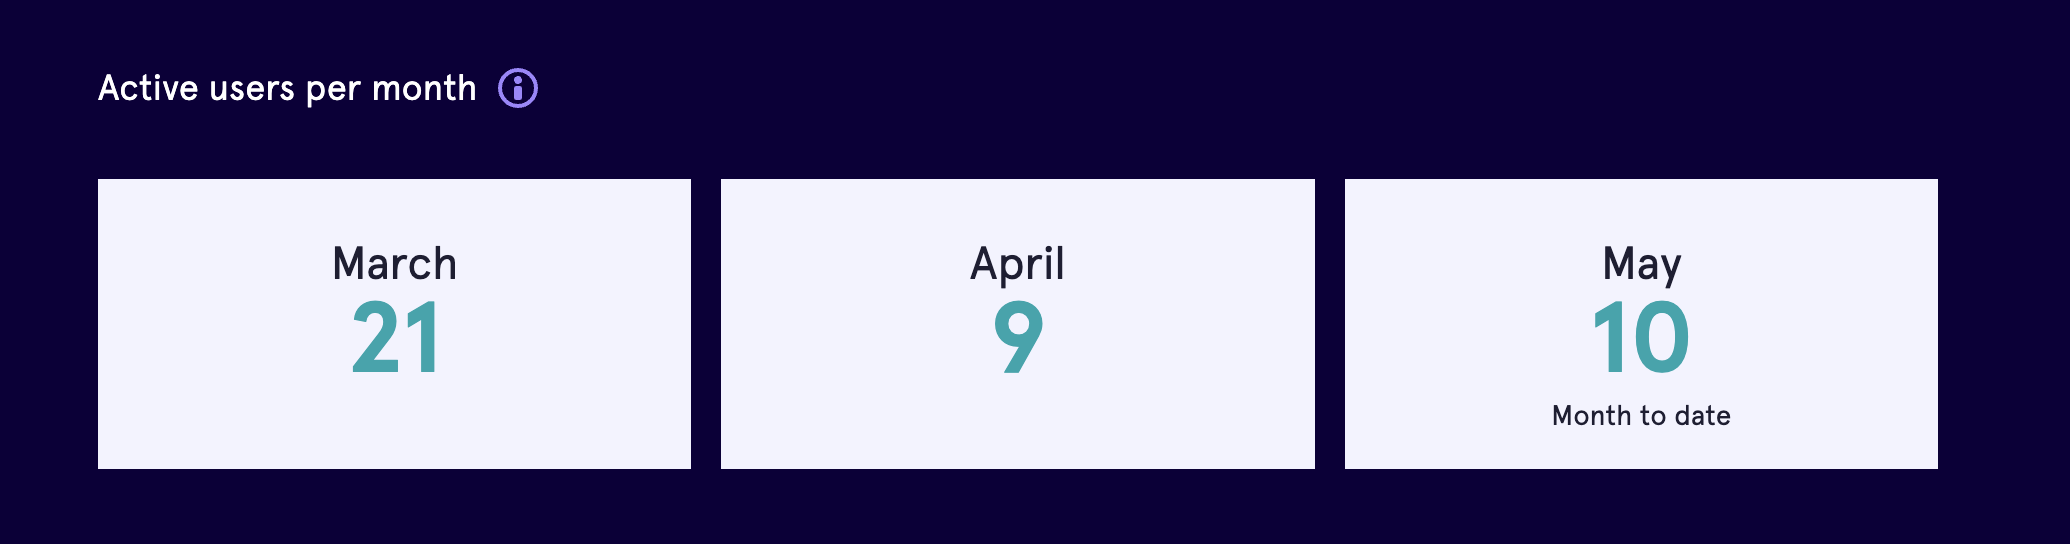
Active users per month
The summary boxes below show the total number of unique active users who were active in the previous 2 calendar months and the current month to date.
Take a look at Course Reports and Team Reports for further information on the specific features of this view.